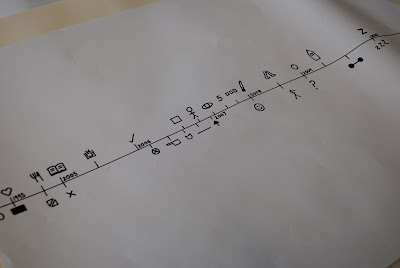
Initially we produced our own small timelines, how we got to where we are- our art life, how we got to like our favourite tv program and then a college day.

Then, in partners we were to combine our time lines and produce a whole one of our lives with the use of pictograms. We split it up into years and used above the line and under the line for each person.


No comments:
Post a Comment